
Table of Contents
We’ve all seen stores with impressive sales figures that are quietly struggling with thin margins or a leaky customer funnel. The most resilient Shopify stores are now focusing on the Shopify metrics that signal sustainable profitability and customer loyalty. This isn't about drowning in spreadsheets; it's about asking sharper questions of your business.
Moving Beyond Revenue for Sustainable Success
Focusing only on top-line revenue is like judging a road trip by the kilometres travelled, not the fuel left in the tank. For ambitious Australian brands in 2025, it’s an incomplete picture. A more sophisticated view is required, one that balances the excitement of acquiring new customers with the quiet, compounding power of long-term value and operational efficiency. At The Hope Factory, we find that data-driven decisions are the bedrock of a resilient e-commerce strategy.
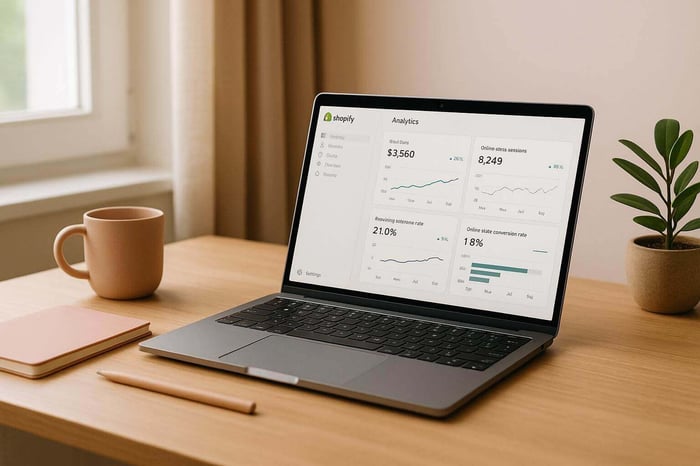
Your Shopify dashboard holds the clues to sustainable growth, if you know where to look.
Tracking the right e-commerce KPIs for Shopify is what separates thriving stores from those that plateau. It’s the difference between guessing what works and knowing what to double down on. This Shopify analytics guide will deliver a no-nonsense look at the specific, actionable Shopify metrics Australia-based businesses need to master for scalable growth.
Optimising Your Customer Conversion Funnel

Before you can build loyalty, you need to make that first sale. This is where your conversion funnel is put to the test, turning a casual browser into a paying customer. Every click, scroll, and hesitation tells a story about your store's effectiveness.
Sales Conversion Rate: The Ultimate Test
Your sales conversion rate is the primary indicator of your store’s appeal and user experience. It answers the fundamental question: how many visitors actually buy something? While the industry benchmark often hovers around 1–3%, fixating on this number is less important than improving your own. For Australian stores, this means tackling local friction points head-on. Be upfront about shipping costs to avoid checkout shock, and offer familiar payment options like Afterpay and Zip. A seamless path from discovery to purchase, built on a solid user experience, is non-negotiable.
Customer Acquisition Cost (CAC): Measuring Your Marketing Spend
Customer Acquisition Cost, or CAC, is simply what you spend on marketing to get one new customer. Think of the money spent on that Instagram ad campaign or Google Shopping placement. Knowing this figure is critical because it directly impacts profitability. If it costs you $50 to acquire a customer who only spends $40, you have a problem. Tracking CAC forces you to be honest about which marketing channels are actually delivering a return.
Actionable Strategy: The Conversion Checklist
If you're wondering how to improve Shopify conversion rate today, here are a few practical steps:
- A/B test your product page CTA buttons: Does "Add to Cart" outperform "Buy Now"? Test colours, text, and placement.
- Optimise for mobile-first browsing: Most of your customers are likely on their phones. Ensure your site is fast and easy to navigate on a small screen.
- Streamline your checkout to three steps or less: Remove every unnecessary field and question. The goal is to make paying as frictionless as possible.
- Add trust signals: Display security badges, customer reviews, and clear return policies to build confidence.
Increasing the Value of Every Transaction
Once you've mastered the art of the first sale, the next step is to increase the value of each customer. It's often far more cost-effective to encourage an existing customer to spend more than it is to find a new one. This is where metrics like Average Order Value and Customer Lifetime Value come into play.
Deep Dive into Average Order Value (AOV)
Increasing your average order value Shopify is about making each transaction more profitable. Instead of just selling one item, you encourage customers to add more to their cart. Concrete strategies include creating product bundles (like a 'Winter Skincare Kit'), offering intelligent cross-sells at checkout ("Customers also bought..."), or setting a free shipping threshold that is just slightly above your current AOV. It’s a gentle nudge that benefits both you and the customer.
The Long-Game: Customer Lifetime Value (CLV)
While AOV is about a single moment, customer lifetime value Shopify (CLV) is the key metric for long-term business health. It represents the total revenue you can expect from a single customer over the entire course of your relationship. As Shopify highlights in their own analysis, a high CLV is a strong indicator of brand loyalty and product satisfaction. The golden rule is that your CLV must be significantly higher than your CAC. This is how you build a truly profitable business, as demonstrated by brands that cultivate a loyal following through exceptional customer experiences.
Connecting AOV and CLV for Predictive Growth
These two metrics are deeply connected. A customer who has a high initial AOV is often signalling a higher level of trust and engagement, which can predict a higher future CLV. They're not just testing the waters; they're diving in. By focusing on both, you create a powerful growth loop: you make more from the first sale and build a foundation for repeat purchases.
| Focus | Key Strategies | Primary Goal |
|---|---|---|
| Average Order Value (AOV) | Product bundling, volume discounts, free shipping thresholds, cross-selling at checkout. | Increase the value of a single transaction. |
| Customer Lifetime Value (CLV) | Loyalty programs, personalised email marketing, subscription models, post-purchase follow-ups. | Build a lasting, profitable customer relationship. |
Refining Your Website and Marketing Performance

Your website and marketing campaigns are constantly generating data. The trick is learning to interpret it correctly to diagnose problems before they impact your bottom line. Think of Shopify metrics as your store’s early warning system.
Interpreting Bounce Rate Correctly
Bounce rate—the percentage of visitors who leave after viewing only one page—isn't always a bad thing. Someone landing on your contact page, finding your address, and leaving is a success. However, a high bounce rate on a product page is a red flag. It might signal that your ad creative doesn't match the landing page, your page is loading too slowly, or the product information is unclear. Context is everything.
Measuring Marketing with Click-Through Rate (CTR)
Click-Through Rate (CTR) measures how many people who see your ad or email actually click on it. It’s a direct reflection of how compelling your message is. A low CTR on a Facebook ad suggests your image or copy isn't grabbing attention. A low CTR on an email campaign points to a weak subject line. This metric demands continuous A/B testing to find what resonates with your audience. For more ideas on testing and refinement, our e-commerce strategy blog offers deeper insights.
Tackling Cart Abandonment Rate
We’ve all done it: filled a cart and then vanished. The cart abandonment rate tells you how often this happens on your store. In Australia, common culprits include unexpected GST or surprisingly high shipping fees to regional areas. According to Shopify's own data, these surprises are a top reason for abandonment. Targeted solutions like abandoned cart email flows that offer a small discount, or displaying security badges prominently at checkout, can effectively recover a portion of this lost revenue.
Monitoring Operational and Financial Health
Beyond customer-facing metrics lies the engine room of your business: your operations and finances. These KPIs reveal how efficiently your business is running and whether your growth is truly profitable.
Understanding Inventory Turnover Rate
Inventory turnover measures how quickly you sell and replace your stock over a specific period. It’s a critical measure of efficiency. A low turnover rate means you have cash tied up in overstocked products (dead stock) that are gathering dust in a warehouse. A rate that's too high might mean you're understocking and missing out on sales. Finding the right balance is essential for healthy cash flow.
Efficient inventory management is crucial for maintaining healthy cash flow in an e-commerce business.
Calculating Return on Investment (ROI)
Return on Investment (ROI) is the ultimate measure of profitability. It answers the question: for every dollar I put in, how many am I getting back? This formula shouldn't just be applied to your business as a whole. Calculate it for specific marketing campaigns, technology investments, and even new product lines. It provides the clarity needed to allocate your budget effectively and cut what isn't working.
The Australian Context: Logistics and Cash Flow
Operating in Australia presents unique challenges that make these operational metrics even more important. Higher domestic shipping costs and complex global supply chains mean that inefficient stock management can quickly erode your margins. As a recent Deloitte report on supply chains highlights, digital transformation is key to building resilience. For Australian e-commerce brands, this means using data to optimise inventory and protect cash flow is not just good practice; it's a survival strategy.
From Data to Decisions: Your Action Plan

Tracking Shopify metrics is meaningless without a plan to act on the insights. The goal is not to collect data, but to use it to make informed decisions that drive real growth. It’s about turning numbers on a screen into a smarter, more profitable business strategy.
Implementation Checklist
Here is a simple plan to get started:
- 1. Choose ONE primary Shopify metric to improve this quarter. Don't try to fix everything at once. Focus on AOV, conversion rate, or another key area.
- 2. Implement two strategies from this guide to target that metric. For example, if focusing on AOV, introduce a product bundle and a free shipping threshold.
- 3. Set a calendar reminder to review progress in 30 days. Accountability is key. Check the data to see if your changes are having an impact.
- 4. Adjust your strategy based on the results. Double down on what works and pivot away from what doesn’t.
If you're ready to turn your data into a powerful growth engine but want expert guidance to get there, our team is here to help. Book a chat with us to discuss your goals.
Sources
- Shopify. (n.d.). Customer Success Metrics: 10 KPIs to Track for Growth.
- Shopify. (n.d.). 11 Basic Ecommerce Metrics You Need to Be Tracking.
- Deloitte. (2023). Digital transformation in supply chain.
FAQs
What is a good conversion rate for a Shopify store in Australia?
While a general benchmark is 1–3%, this varies widely by industry. A store selling high-consideration furniture will naturally have a lower rate than one selling affordable accessories. The most important goal is to consistently improve your own baseline month over month.
How can I calculate Customer Lifetime Value (CLV) in Shopify?
Shopify's analytics provide the raw data needed, such as customer order history. However, a true CLV calculation often requires exporting this data and using a simple spreadsheet formula (Total Revenue from Customer - Cost to Acquire & Serve Customer) or using a dedicated Shopify app to get a more automated and precise figure.
Where can I find these metrics in my Shopify admin?
Most of these key metrics can be found directly within your Shopify dashboard. Navigate to the 'Analytics' and 'Reports' sections. Here, you can explore dashboards for sales, customers, and marketing performance, and create custom reports to dig deeper into your data.